REAL TRADING BREAKDOWN (VERIFIED EXAMPLE)
Below is a transparent breakdown of a real-world trading session executed by the Roldfire, the same fund manager responsible for day trading strategies used within Roldfire PIC. This video showcases both winning and losing trades, with nothing hidden. Every executed trade is verifiable and reflects our actual trading process and discipline.
We don’t cherry-pick wins, nor do we hide losses. We present our trading as it truly is, with full transparency and accountability. This video is not marketing, it is proof of execution discipline, not just theory.
Please note:
The red “SL” marker in the video indicates that the stop loss was manually moved into the profit zone (a technique we use frequently to lock in gains), and the position was closed at that level, not at a loss.
The right-hand column of the trading terminal shows the realized result of each trade (profit or loss).
Performance Summary:
Net profit achieved: $12,375 in only 9 calendar days (8 days of active trading)
Initial target: $10,000 profit in 10 days
Win rate: 63%
Maximum realized drawdown: less than $1,000
Maximum unrealized drawdown (floating loss): less than $2,000
We started the period strong, generating approximately $7,000 in profit on the very first day, without entering into any drawdown. Following this, and due to the strong initial result, we increased risk exposure, a standard tactical decision based on momentum and capital cushion.
As a result of higher exposure and volatile market conditions, we gave back our gains. This is a natural part of risk-managed trading and was fully anticipated within our risk tolerance model. During this period, we experienced a maximum unrealized drawdown below $2,000, and realized drawdown never exceeded $1,000 relative to the starting balance.
Discipline and Adjustments:
After reaching drawdown territory, we immediately scaled back risk and focused only on higher-quality setups. This is where our strategy emphasizes discipline, consistency, and emotional control. We avoided the common mistake of "revenge trading" or gambling after losses, a tendency that derails most traders. Instead, we strategically returned to profit through refined execution.
This is our operational approach:
We increase risk only when in a profit buffer, and scale back when we return capital to the market. The focus is not on short-term volatility, but on ending each month in profit.
The outcome of this 9-day trading period was a net gain exceeding $12,000, surpassing the $10,000 goal, with risk strictly contained.
Technical Transparency:
Time zone: Trade times shown in the video reflect the MT4 platform's default time zone. All trades are easily verifiable by checking market movements on those dates.
Swap fees: 0 on all trades, these were scalping and intra-day executions, not swing trades.
Price discrepancies: Slight deviations between Take Profit (TP), Stop Loss (SL), and actual close prices are due to execution slippage.
Risk-Reward Ratio (RRR): We do not rely on traditional RRR calculations for actively managed trades. Since we frequently move Stop Loss into profit zones (dynamic risk-locking), conventional RRR tracking becomes irrelevant. However, we always know the exact risk per trade, and it is never above our predefined loss threshold.
Limit orders shown in the video without profit/loss values: These were pending orders that were cancelled before being executed.
Risk Management Metrics:
Max floating drawdown (equity below starting balance): under $2,000 (our internal limit was $5,000, goal achieved)
Max realized drawdown: under $1,000
Largest losing trade: under $2,000 (occurred while already in profit, risk was absorbable)
Largest winning trade: above $2,000
Days traded: 8 out of 9 days (1 day without trading)
Tokyo session note: A few Tokyo sessions were not executed to plan, contributing to some larger losses during that window, but the broader picture always matters. Trading is a marathon, not a sprint, and the marathon result here is $12k+ net profit.
Connection to Roldfire PIC
This real trading breakdown is a practical illustration of the trading discipline and strategy we will apply within Roldfire PIC.
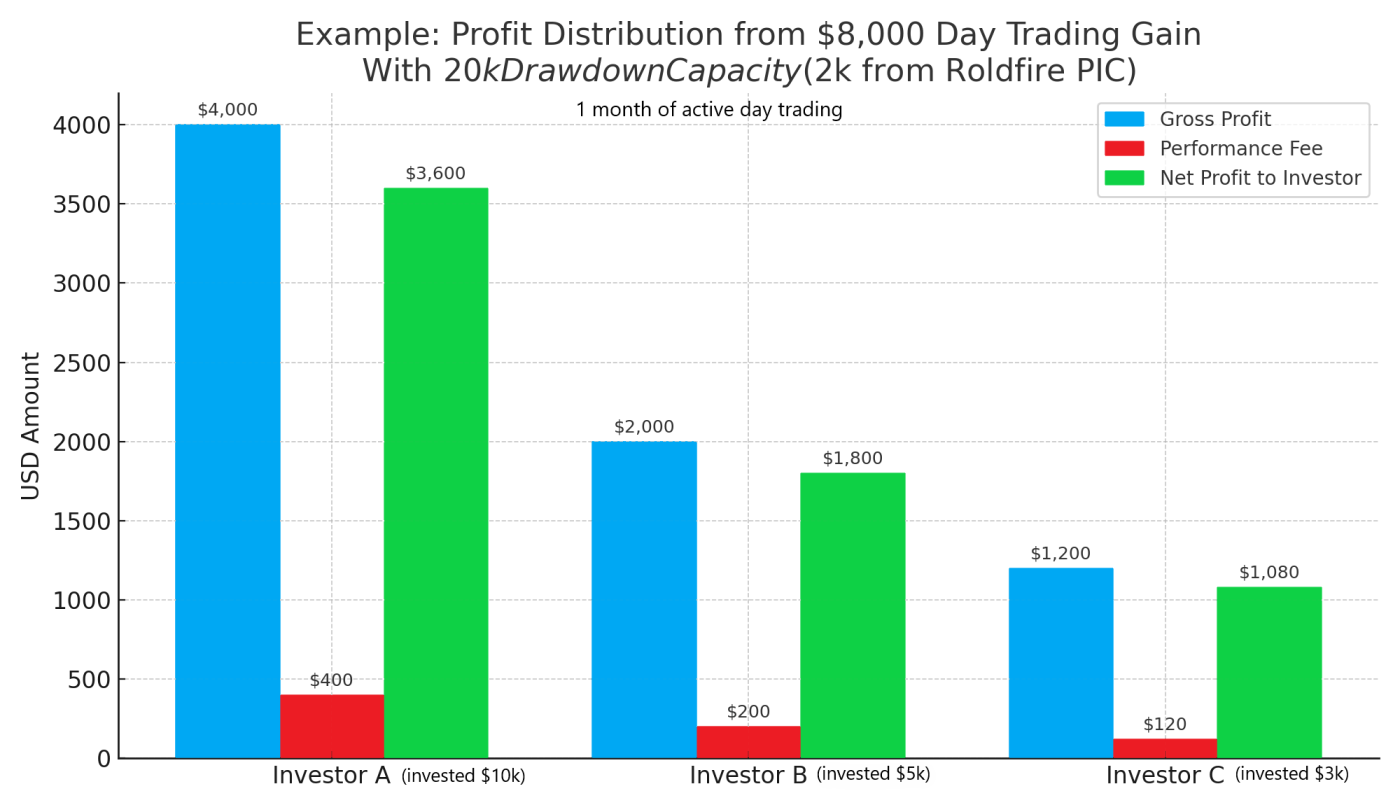
In this specific showcase, only $10,000 of drawdown capacity was used, meaning the trading capital and available leverage was significantly lower than in the earlier illustrated example (which assumed $20,000 of risk capital). Despite that, the trading strategy still generated over $12,000 in real profit (more than in a hypothetical example at the top of this page), exceeding the goal with lower risk.
This example demonstrates how investors in Roldfire PIC may benefit from monthly profit distributions based on the same strategy and discipline. While future results can never be guaranteed, this breakdown reflects a realistic reference for the types of monthly returns that are possible, depending on the amount invested and capital structure used.
To further reinforce trust while our fund remains in its early stage of development:
Until we formalize an agreement with an independent external auditor, every Roldfire PIC investor has the right to request direct access to our full trade records and execution logs. Additionally, the Roldfire PIC Investor Platform will launch soon, enabling every investor to monitor their investment value in real time and to review and independently verify each trade executed within the day-trading component of our investment strategies.
This ensures that reported NAV growth and profit distributions are verifiably derived from actual trading activity, not simulations or unverifiable sources.
We believe that true credibility is earned through transparency, and we are committed to demonstrating, not just claiming, that Roldfire PIC is built on real execution, not on marketing illusions or any Ponzi-like structure.
Disclaimer: The trading performance detailed above and shown in the video is real, but provided for illustrative purposes only. It does not constitute a guarantee of future returns. Trading always carries risk (under this strategy, the risk of loss to Roldfire PIC’s capital is structurally eliminated, providing a significant advantage to investors.) , and past performance is not indicative of future results. All trading activity is conducted within strict internal risk limits, and every effort is made to protect investor capital.